The physical properties and behavior of polymers and polysaccharides depend to a large extent on the nature of the molecule itself. Molecular weight and molecular weight distribution, molecular size and structure all influence the behavior of the substance. Gel Permeation Chromatography (GPC), also known as Size Exclusion Chromatography (SEC), is the most commonly used tool for evaluating these parameters.
GPC works by separating the sample as it flows through the porous inert column matrix. Smaller molecules enter the pores of the packing, while larger molecules are excluded and therefore pass through the column more quickly. The result is a separation based on hydrodynamic volume, and what we want to know is the molecular weight of the sample. Previously, molecular weight was estimated by comparing the elution time of the sample to the elution time of a known molecular weight standard. Now, light scattering detectors are a common tool for measuring the molecular weight of polymers without relying on retention time. Rg parallel measurements using multi-angle light scattering (MALS) and intrinsic viscosity provide excellent results for the molecular structure of the synthetic and natural polymers and their molecular weight.
Viscotek SEC-MALS 20 (Figure 1) is a 20-angle light scattering detector that measures molecular weight and Rg (gyng radius). The detector can be used as part of a multi-angle detector GPC system in combination with light scattering and other detectors such as refractive index (RI), ultraviolet (UV) and intrinsic viscosity (IV) to simultaneously generate large amounts of sample information. .
In this application note, molecular weight data measured using Viscotek SEC-MALS 20 is combined with Rg and IV measurements to study the molecular structure of different polysaccharides, including amylopectin, dextran, hydroxypropyl cellulose. (HPC), pectin and gum arabic. In addition, the differences between the constellation and the Mark-Houwink graph were studied.
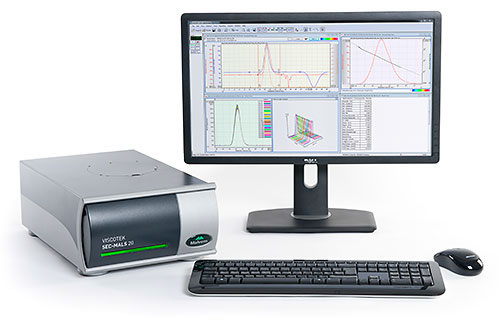
Figure 1: Viscotek SEC-MALS 20 System
Materials and Method
Connect the SEC-MALS 20 detector to the Viscotek GPCmax and Viscotek TDA systems. Samples were separated by using two Viscotek A6000M columns (dextran, pectin, and acacia) or one column (amylopectin, hydroxypropyl cellulose). The mobile phase is a phosphate buffer. The SEC-MALS 20 system was calibrated with a 19kDa PEO standard. Both the detector and column are maintained at 35 °C to ensure good separation and maximize baseline stability.
All samples were dissolved in the mobile phase at a concentration of 0.5 to 3 mg/ml and injected in a volume of 100 μl. The molecular weight of the dextran sample is known and can be used to check the calibration results. All samples were dissolved overnight to ensure complete dissolution.
result
All samples were successfully separated in the system. The RI overlay chromatograms of pectin, acacia and dextran (Fig. 2A) and amylopectin and HPC (Fig. 2B) are shown.
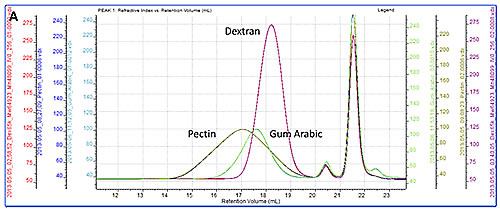
Figure 2A: RI overlay chromatogram of pectin, dextran and gum arabic.

Figure 2B: RI overlay chromatogram of amylopectin and HPC.
As a more detailed example, Figure 3A shows a chromatogram of pectin showing the results of the RI, LS (90°) and IV detectors. Figure 3B shows the angle data for the SEC-MALS 20 detector. A slight angular dependence can be seen from different angles, allowing measurement of the Rg of the sample. Figure 3C shows that the RI peak overlaps with the measured molecular weight, Rg, IV and Rh.

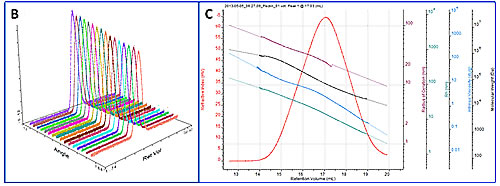
Figure 3: A. Chromatogram showing the response of the pectin RI (red), LS (90°) (orange), and IV (blue) detectors. B. A curve showing the MALS data. C. Display RI peak derived data that overlaps with the measured Rg (maroon), molecular weight (black), IV (cyan), and Rh (cyan).
Table 1: Molecular weight distribution, IV, Rh and Rg values ​​of different polysaccharide samples measured.
Sample ID | Glucan | Pectin | Gum arabic | Amylopectin | HPC | |||||
Injection | 1 | 2 | 1 | 2 | 1 | 2 | 1 | 2 | 1 | 2 |
Mn -(kDa) | 51.42 | 51.56 | 51.07 | 52.40 | 292.81 | 291.42 | 185.77 | 187.28 | 61.86 | 58.06 |
Mw-(kDa) | 63.18 | 63.34 | 115.07 | 115.89 | 515.13 | 519.06 | 196.57 | 197.49 | 83.03 | 81.86 |
Mz -(kDa) | 77.84 | 78.29 | 249.56 | 252.81 | 974.47 | 1,000.00 | 210.70 | 210.47 | 118.79 | 125.51 |
IV -(dl/g) | 0.256 | 0.256 | 3.671 | 3.689 | 0.158 | 0.156 | 0.674 | 0.678 | 1.050 | 1.066 |
Rh - (nm) | 6.06 | 6.07 | 16.97 | 17.06 | 10.26 | 10.21 | 16.63 | 16.70 | 13.98 | 13.93 |
Rg - (nm) | 7.55 | 7.09 | 25.83 | 25.98 | 8.08 | 8.55 | 16.42 | 16.58 | 22.48 | 20.03 |
Table 1 summarizes the results for the different samples. Repeated injections were performed in the study, and all measurements between each injection showed excellent repeatability.
Although studying the numerical results is a good quantitative method for comparing samples, drawing the data on the Mark-Houwink plot and the conformational map is also a visually ideal way to quickly compare the samples. The Mark-Houwink plot shows the intrinsic viscosity as a function of molecular weight, while the conformational plot shows the Rg value as a function of molecular weight. Therefore, both can be used as a way to observe that the molecular size increases as the molecular weight increases. Both can be instantly compared between different samples and are also well suited for studying branching and other structural changes. In this case, we only focus on the distribution of different polysaccharides on the curve.
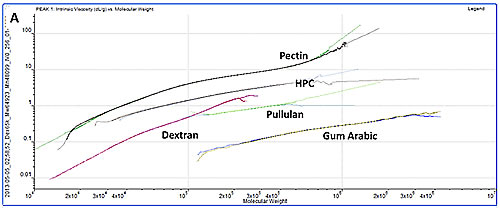
Figure 4A: Mark-Houwink overlay of polysaccharides.
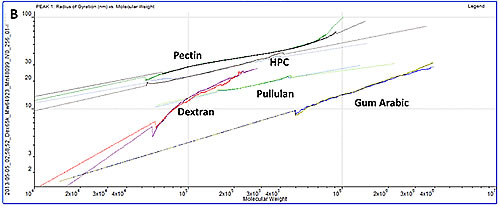
Figure 4B: Conformational overlay of the polysaccharide. The solid line indicates actual data and the dotted line indicates extrapolated data.
discuss
When studying Mark-Houwink and the constellation diagram, the information contained in the results becomes clear. Gum arabic is the highest molecular weight in the sample, however, its curve in the two figures is the "lowest": in terms of mass, it is the smallest (conformation) or the highest density of the studied molecules (Mark- Houwink figure). Although gum arabic is mainly a polysaccharide, it usually contains a protein component, which increases the molecular mass while increasing the size of the smaller molecule, so the above results are also expected.
On the other hand, the curve of pectin in both figures is the longest, indicating that it is the most dispersible molecule in the molecule under study. This is consistent with having the widest peak in the chromatogram. This is more clearly seen on the Mark-Houwink diagram than on the constellation diagram. Since Rg is shown, the conformational map is only for molecules with a radius of about 10 nm, and the sample light scattering of this radius is anisotropic. The pectin distribution map contains some substances below this radius limit and cannot measure its Rg. IV is not limited by the size of the molecule and can therefore be measured throughout the molecular weight distribution. As the "highest" molecule in the two figures, pectin identifies itself as the largest (conformation map) of the molecule under study and the smallest density (Mark-Houwink plot).
HPC, amylopectin and dextran were distributed between the pectin and gum arabic samples, indicating a structure between these two extreme values.
Although the information given in these two figures is similar, it is worth noting that their respective advantages and disadvantages make them suitable for different applications. As mentioned above, the conformational map is not available for smaller molecules. However, as a direct measure of molecular size, it does not depend on any shape model. To convert an IV to a size value, you must assume some shape models, such as the Rh calculation in Table 1.
In summary, the molecular weight, size and intrinsic viscosity of the selected polysaccharides were measured by the Viscotek TDA and SEC-MALS 20 systems in this application note. Then draw a constellation and a Mark-Houwink plot, both of which clearly show the different structures of the different samples. It can be seen from the data that the difference in molecular structure between different polysaccharides is very obvious and can be easily observed.
Previously, this level of characterization was not possible with a single detector GPC system. Natural and synthetic polymer samples can be characterized in detail by combining light scattering and intrinsic viscosity detectors with GPC.
To read more, please click on the following link:
http://
Biotechnology,Tebuthiuron,Trifloxystrobin,Flufenacet,Amicarbazone,Prothioconazole,Sulfentrazone
Changzhou Satidi Import and Export Co., Ltd. , https://www.guanjiejt.com